


7 min read

Every year, Safe Work Australia releases an annual report analysing the work health and safety statistics across Australia.
The Key Work Health and Safety Statistics, Australia 2022 provides an overview of the latest national data on work-related fatalities and workers’ compensation claims.
This includes trends, gender and age comparisons, and industry and occupation breakdowns.
The report is broken down into 3 notable areas:
- Work-related injury fatalities
- Work-related injury and disease
- Mental health (a new inclusion)
Summary: Our key findings
Mental Health Claims are rising and costing more than physical health claims
- Mental health claims have risen from 6% of all serious claims in 2014-15 to 9% in 2020-2. The median compensation paid was $55,270 per serious claim, compared to $13,883 for physical injuries and diseases.
Furthermore, Mental stress claims have risen by a staggering 10.16% from last year's results.
The strain on the Health system is showing
- The number of serious claims in Health workers has increased by 21.46% in the past 12 months. This is likely a reflection of the pressure the Health system is under due to COVID-19 and the lack of international workers.
- The Health care and Social Assistance industry had the highest proportion of mental health claims.
- Vehicle collisions continue to be the main cause of fatalities, with over 1 in 3 accidents coming from a motor vehicle accident.
- Whether it's due to lone workers in remote areas, seasonal workforces, vehicle collisions or anything in between, Agriculture continues to be the highest-risk industry with the most fatalities and claims per worker.
The importance of safety is setting in - fatalities are dropping
- Although serious claims have risen across the continent, fatalities have decreased since 2020, which is an amazing result.
Detailed Summary - Key findings and trends
Fatalities
Fatalities are, unfortunately, the worst possible scenario in a workplace. We do everything in our power to mitigate risks by controlling hazards to eliminate unwanted events leading to fatality.
While we cannot always avoid fatalities, it's important to understand their causes on trends so that we are aware of the risks workers face.
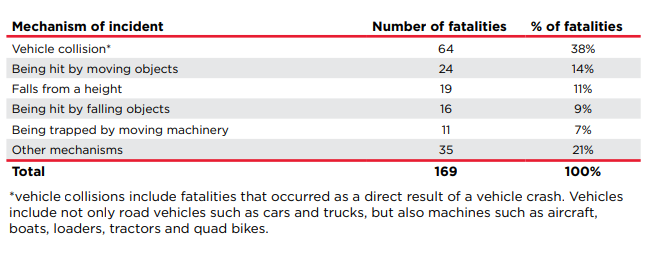
The good news is that in 2021 workplace Fataliaites had a decrease from the previous year, 169 compared to 194.
Cause of Fatalities
Vehicle collisions continued to be the main source of fatalities.
Industries most exposed
- Agriculture, forestry and fishing = 33 fatalities (-13)
- Transport, postal and warehousing =52 fatalities (+3)
- Construction = 24 fatalities (-12)
- Manufacturing = 16 fatalities (-3)
Occupations most at risk
- Machinery operators & drivers = 68 fatalities (+1)
- Labourers = 34 fatalities (-7)
- Managers = 24 fatalities (-11)
- Technicians & trades workers = 22 fatalities (-4)
Work-related injury and disease
Safe Work Australian compiles the National Dataset for Compensation-based Statistics (NDS), which comprises information on workers’ compensation claims provided by each of the jurisdictional workers’ compensation authorities.
Overview of Serious claims statistics, 2020-21
Overall, the serious claim frequency rate has decreased by 17% from 2010-11 to 2019-20. However, there has been a minor spike since 2020. This could be related to less time lost due to the COVID-19 lockdowns that we faced in 2020.
- 130,195 total serious claims (up from 120,355 in 2020)
- Median time lost = 7 weeks per claim (up from 6.6 in 2020)
- Median compensation per claim = $15,072 (up from 13,500 in 2020)
Workers’ compensation claims
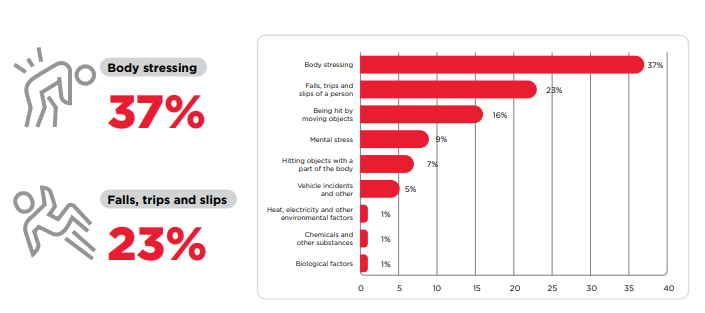
Body stressing was the leading cause of serious workers’ compensation claims in 2020-21, accounting for 37% of all serious claims.
Body stressing is a term that covers a broad range of health issues like strains, sprains and soft tissue injuries.
|
Mental stress |
10.16% |
|
Body stressing |
8.87% |
|
Falls, trips and slips of a person |
7.98% |
|
Being hit by moving objects |
4.75% |
Serious claims by occupation
- Labourers = 19.2 serious claims per million hours worked (up from 18.1 in 2020)
- Community and personal service workers = 11.8 serious claims per million hours worked (down from 13.9)
- Machinery operators and drivers = 11.7 serious claims per million hours worked (relatively unchanged)
Serious claims by industry
Agriculture, forestry and fishing continued to have the highest number of claims per employees' worked.
What’s interesting to note is that Health care and Social Assistance claims have significantly climbed in the last 12 months. This is most likely due to the pressure the health industry has been under since COVID-19 and the lack of talent migrating to Australia.
|
Industry |
Frequency rate (serious claims per million hours worked) |
|
|
Agriculture, forestry and fishing |
11.1 |
15.63% |
|
Manufacturing |
9.6 |
12.09% |
|
Transport, postal and warehousing |
8.8 |
-1.12% |
|
Health care and social assistance |
10.2 |
18.60% |
|
Construction |
8.8 |
3.53% |
Mental health conditions
This is a relatively new section to the Key work health and safety statistics Australia 2022.
The amount of mental claims has risen by 10.16% in the last 12 months and some experts are expecting it to continue growing.
83% risk in Health care and Social Assistance industry had the highest proportion of claims.
Whether this is an effect of the post-COVID-19 lockdowns, the effects of the economy or the fact that the world is becoming more aware of these conditions, the results paint a significant picture of the effects it has on workers and employees:
- Mental health conditions account for a relatively small but increasing proportion of serious claims, rising from 6% of all serious claims in 2014-15 to 9% in 2020-21p.
- In 2020-21, the largest share related to anxiety or stress disorders (36%) or reaction to stressors – other, multiple or not specified (34%).
- The median time lost for mental health conditions was 30.7 working weeks per serious claim, compared to 6.2 working weeks per serious claim for physical injuries and diseases.
- The median compensation paid was $55,270 per serious claim, compared to $13,883 for physical injuries and diseases.
- The median time lost (in working weeks) for mental health conditions has increased markedly in recent years, from 18.8 working weeks in 2015-16 to 30.7 working weeks in 2019-20.
Related Posts
Australian WHS Strategy 2023-2033
Safe Work Australia has released its Australian Work Health and Safety (WHS) Strategy 2022-2032, a...
Incident rate benchmarking: a guide for Australian organisations
Workplace injuries and illnesses significantly impact an organisation’s overall health. Incidents...
Navigating Industrial Manslaughter laws
In July 2023, The Model Work Health and Safety (WHS) Act was amended to introduce a jurisdictional...